How PredRet works

Stay tuned for more. Please refer to the open access paper for now.


Examples of robust monotonically constrained generalized additive models between the retention times of compounds in two different chromatographic systems. Examples are given of a “good” model (A), a model with many outliers (B), a model where there are only enough data points to get predictions in a small RT interval (C) and a model where there are not enough data points to establish a model with reasonable prediction accuracy (D). All examples are of the initial model that will be refined further as erroneous entries are discarded.

Figure 1. Examples of robust monotonically constrained generalized additive models between the retention times of compounds in two different chromatographic systems. Examples are given of a “good” model (A), a model with many outliers (B), a model where there are only enough data points to get predictions in a small RT interval (C) and a model where there are not enough data points to establish a model with reasonable prediction accuracy (D). All examples are of the initial model that will be refined further as erroneous entries are discarded.

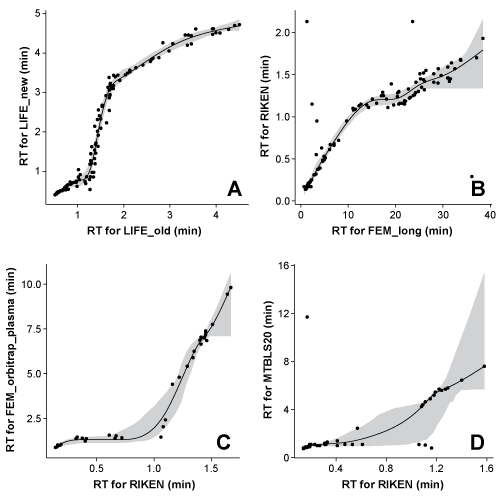
The RTs (experimentally determined in your system and in another users systems) of a number of compounds are used to create projection models between the RTs in the two systems. You can see examples of such models in the plot to the right (Figure 1). These models can then be used to predict the RT of a compound if the RT is known in the other system, but not in yours. Building these models between all chromatographic systems in the database thus allows us to predict the RT of a high number of compounds in your system.


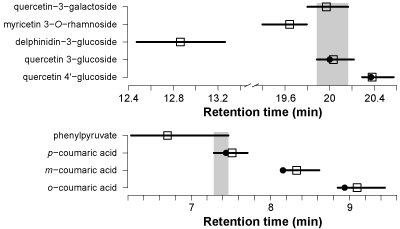
Below you can see an example of predicted RTs for five isomers (Figure 2). Delphinidin-3-glucoside can be clearly distinguished from the others based on the predicted RT and prediction intervals. Myricetin 3−O−rhamnoside and quercetin 4′-glucoside can in theory be distinguished from the others while quercetin 3-glucoside and quercetin 3-galacoside are not separated.


The predicted retention times of two sets of isomers (predicted to different systems). The black lines indicate the prediction intervals. The squares indicate the predicted retention time while the circle indicates the experimental retention time (when available). Grey areas indicate overlapping prediction internals. The predictions indicate that some structurally very similar isomers can be distinguished solely based on the predicted retention times.

Figure 2. Black lines indicate the PI. The squares indicate the predicted retention time while the circle indicates the experimental retention time (when available). Grey areas indicate overlapping prediction internals.
Creative Commons License

The data available on this site is licensed under a
Creative Commons Attribution-ShareAlike 4.0 International License.